How this site is made
The globe on this page
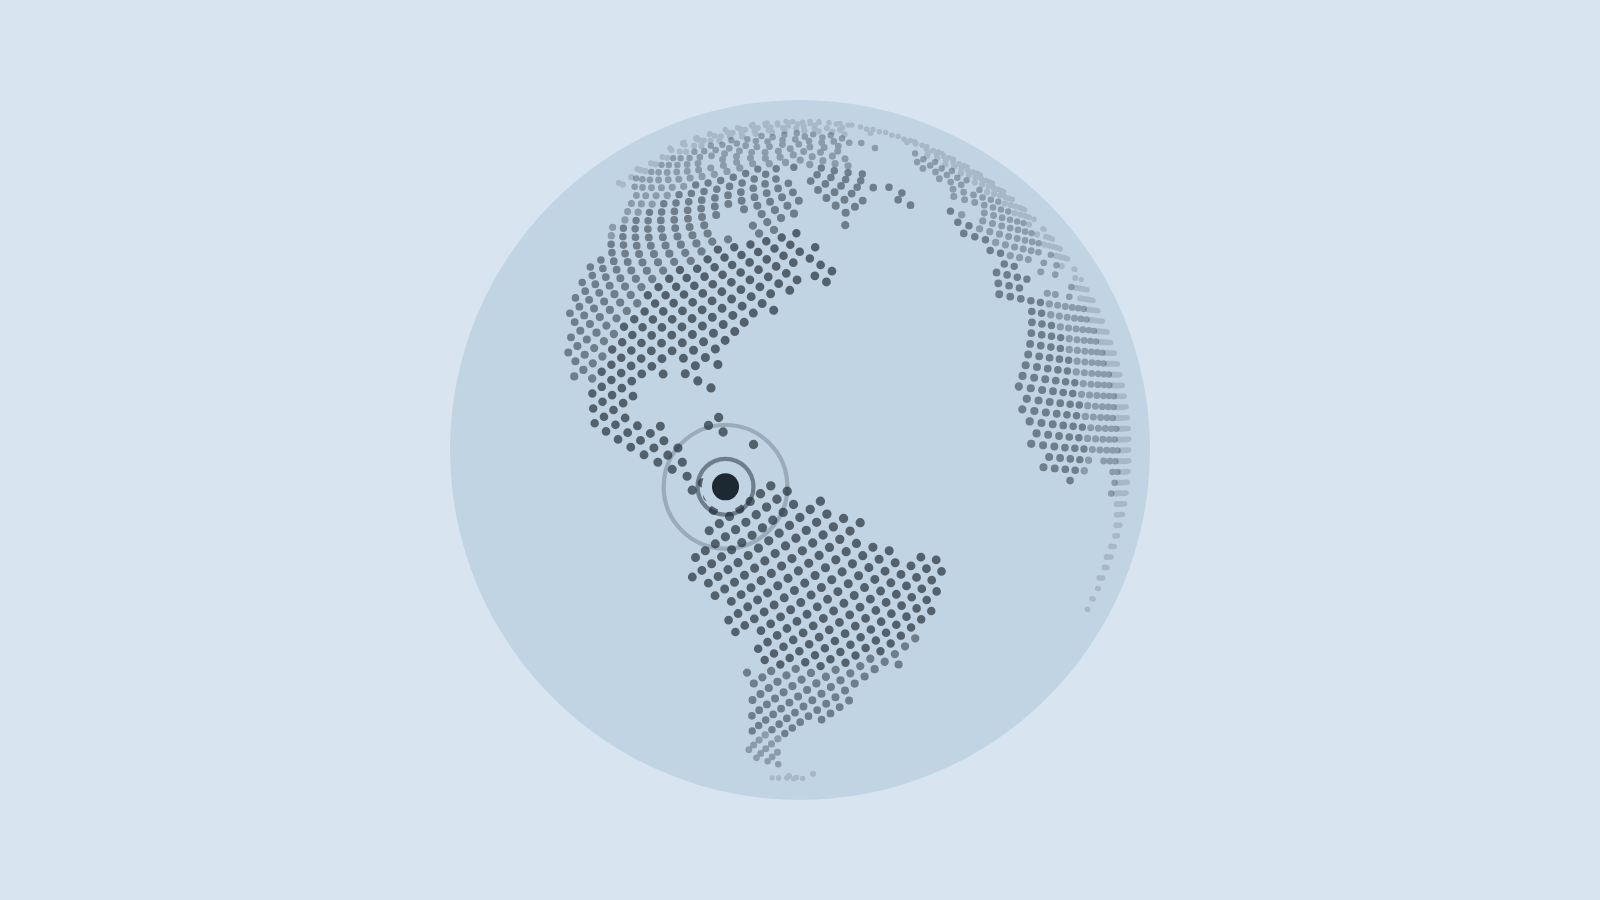
On the first page of this site there is a small globe that marks where I live. It is the only thing on the page that moves, and it is about eighty lines of JavaScript on a plain canvas, with no library behind it. This is how it works.
Why not a library
The usual choice for a dotted globe is cobe, and it is good. It draws with WebGL, and what it draws is a lit sphere, with a glow around it. This site is built on a design system whose rules include flat tones and no gradients or glows, so a lit ball would have been the one thing on the page that didn’t belong. I wanted the globe in the panel’s own two colours: its ink for the land, a deeper tone of its ground for the sea.
Doing that by hand takes three things: a map, points on a sphere, and a way to turn it.
A map in one kilobyte
The globe has to know where there is land, and nothing else. So the map is a grid of 128 by 64 cells covering the whole earth, with one bit for each cell: land or not. That is 8,192 bits, or 1,024 bytes, and it sits in the script as one line of base64. I sampled it from the map that cobe draws (cobe is MIT licensed).
const mask = Uint8Array.from(atob(LAND), c => c.charCodeAt(0));
const isLand = (lat, lon) => {
  const k = Math.min(63, Math.floor((.5 - lat / Math.PI) * 64)) * 128
          + Math.min(127, Math.floor((lon / Math.PI + 1) * 64));
  return mask[k >> 3] & (128 >> (k & 7));
};
A cell is nearly three degrees wide, about 310 km at the equator. That is coarse, but the globe is drawn 216 pixels across at most, and at that size nothing finer would show.
Dots spread evenly
A dot at every crossing of latitude and longitude would crowd the poles. The standard way around that is a Fibonacci spiral: go from one pole to the other in equal steps of height, turning by the golden angle at each step, and the points come out evenly spaced over the whole sphere.
for (let n = 0, N = 7200; n < N; n++) {
  const y = 1 - (2 * n + 1) / N, r = Math.sqrt(1 - y * y);
  const a = n * 2.39996323, x = r * Math.sin(a), z = r * Math.cos(a);
  if (isLand(Math.asin(y), Math.atan2(x, z))) dots.push(x, y, z);
}
Of the 7,200 points, 2,405 fall on land and are kept. This runs once, when the page loads.
Drawing it
Each frame turns every dot by the globe’s rotation, drops the ones on the far side, and draws the rest as small circles. Depth does the work that light does on a lit globe: a dot facing you is larger and darker, and a dot near the edge is small and faint.
Giving each of two thousand dots its own opacity would mean two thousand separate fills. So the dots are sorted into four bands by depth, and each band is drawn as one path with one fill. That is four fills a frame, and at this size four steps of opacity read as a smooth falloff.
for (let band = 0; band < 4; band++) {
  ctx.globalAlpha = .16 + band * .17; ctx.beginPath();
  for (let i = 0; i < dots.length; i += 3) {
    const [sx, sy, depth] = see(dots[i], dots[i + 1], dots[i + 2]);
    if (depth <= 0) continue;
    if (Math.min(3, Math.floor(depth * 4)) !== band) continue;
    const dot = R * (.0075 + .006 * depth);
    ctx.moveTo(sx + dot, sy); ctx.arc(sx, sy, dot, 0, TURN);
  }
  ctx.fill();
}
The colours are not written in the script. It reads the globe’s text colour and background from the page, and reads them again when the theme changes, so it is right by day and by night without knowing either palette. One catch: the panel’s colours blend to the new theme over about half a second, and read at the instant of the change, Firefox and Safari hand back the old ones. So the globe keeps reading for that half second and blends along with the panel.
How it moves
The globe faces Cartagena, tilted a little so that you see it from slightly above, and sways about 17 degrees to either side over 26 seconds. You can drag it: a drag across the globe’s radius turns it by one radian, so the land follows the pointer. Let go with some speed and it carries on, then a soft spring brings it home:
turn += vTurn + (rest - turn) * .03;   // a little of the way home
vTurn *= .94;                          // and the flick dies away
At the mark, two rings spread and fade, half a cycle apart.
When nobody is looking
Three things keep it from costing more than it should. It stops drawing when it scrolls out of the window. With reduced motion switched on it neither sways nor pulses; it can still be turned by hand, and once it has come back to rest it stops drawing altogether. And without JavaScript the panel shows the place, the coordinates and the time zone, with no empty circle where the globe would have been.
The site’s whole script, of which the globe is the larger part, is 4 kB gzipped.
What the map leaves out
An island smaller than a cell can fall between the samples. Jamaica, Puerto Rico and Hawaii are not on this globe, while Cuba and Hispaniola are. A map of 256 by 128 would have them and would weigh four kilobytes. At 216 pixels the difference is a handful of dots.